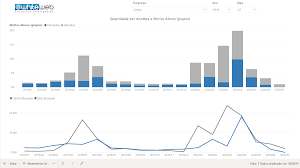
We’re Power BI experts delivering actionable Business Intelligence solutions that drive measurable results. Build smart KPIs and interactive dashboards with this powerful platform.
SMART CONSULTING
Partner with a top-tier Power BI consultancy – recognized as a Gartner Magic Quadrant Leader – to deploy enterprise-grade Business Intelligence (BI) and Analytics (BA) solutions. Our Microsoft Power BI-powered services deliver unmatched cost efficiency and impact.
We build custom dashboards tailored to your needs, enabling Faster, data-driven decisions, Seamless connectivity to Excel, Databases, Big Data, and 300+ other sources and Self-service analytics for teams
Invest in Power BI excellence and accelerate growth with a certified Power BI partner.

OUR PROCESS
Data Mapping & Environment Setup
We decode your business needs, transform raw data into actionable insights, and deliver strategic solutions – not just meaningless charts.
Project Prototyping Phase
We develop a working prototype and present it to clients before full development begins. This critical step Prevents rework, Boosts productivity and Lets clients visualize their final BI solution
Development Phase
Following client needs mapping and prototype approval, we execute the development phase leveraging industry best practices – prioritizing data integrity and dashboard usability.
Dashboard Validation & Testing
This phase focuses on rigorous testing of dashboards and KPIs. We Validate data accuracy with end-users, mplement required refinements and Deliver a polished final product
User Training
We provide customized training on your dashboards and reports, empowering teams to Master Power BI’s full capabilities, Access critical business insights instantly and Make data-driven decisions with confidence
Power BI Technical Support
We offer on-site and remote support plans for Dashboard maintenance and New KPI implementations
HOW WE DELIVER
As a Microsoft Power BI SILVER Partner, we’re committed to delivering enterprise-grade BI solutions to companies of all sizes.
Our dedicated Power BI team offers tailored plans for every industry. Start today with our corporate Power BI solutions.
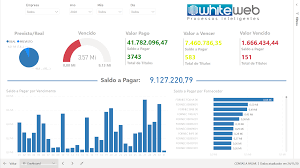
Accounts Receivable Analytics
Top delinquent accounts by days overdue or amount outstanding. Aging report with customizable date ranges. Actual vs. projected collections analysis. Per-customer receivable balances
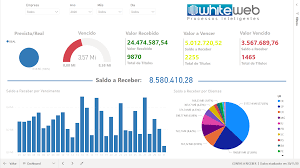
Accounts Payable
Actual vs. forecast analysis. Summary of overdue and upcoming invoices. Outstanding balances by supplier. Invoice aging and analysis of overdue amounts by day, as well as ranking of delays by value and days overdue.
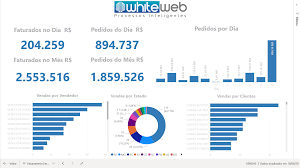
Billing
Real-time information on both billing and order entry, right at your fingertips. Multiple grouping options such as by customer, product, state, and salesperson, as well as various drill-down and customization possibilities.
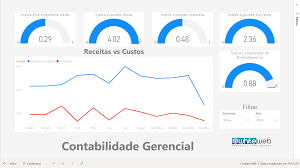
Accounting
Balance sheet and income statement for two years with year-over-year variance analysis. Drill down to the ledger account level. Trial balance for the period and 12-month trend. EBITDA evolution analysis.
Payroll
Dashboard summarizing payroll and absenteeism with variance analysis compared to the previous period. Payroll analysis, terminations, salary adjustments, and absenteeism by department and position.

Cash Flow
Analysis of potential cash shortfalls by cross-referencing bank balances, accounts payable, and accounts receivable. Visualization of projected vs. actual payables and receivables. Simulation of revenue increases or expense reductions to support decision-making.
GARTNER
It’s a series of market research reports published every 1–2 years by the IT consulting firm Gartner, showcasing the top-performing companies in the IT market.
These reports evaluate vendors based on key capabilities, such as:
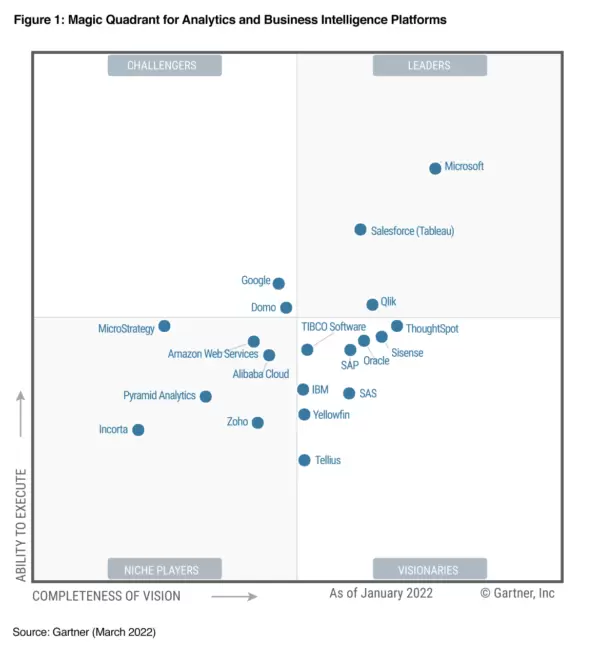
In the results:
The horizontal axis represents the vendor’s vision, while the vertical axis shows execution ability.
Thus, the further up and to the right a product appears, the more comprehensive it is.
Speak with the expert
Your business is unique – so are your needs. We deliver custom solutions to streamline operations, boost efficiency, and transform raw data into high-impact strategies.
Beyond its massive market reach and integration with Office 365, Power BI stands out due to its comprehensive, visionary roadmap. It delivers:
In today’s business landscape, data is the key to making informed, strategic decisions. Yet, data complexity often demands specialized expertise to unlock its true value. That’s where Power BI Consulting comes in—a proven approach revolutionizing corporate analytics.
In this article, we’ll explore What Power BI Consulting is, How it benefits your business, Steps to hire the right experts.
Power BI Consulting is a specialized service provided by data analytics experts proficient in Microsoft Power BI—a suite of business intelligence (BI) applications and services designed to collect, transform, and visualize data effectively. This consulting guides organizations in deploying and leveraging Power BI to unlock actionable insights from their data.
Power BI Consulting delivers critical value to businesses through:
Follow these key steps to select the right Power BI consultant for your business:
Power BI’s complexity can challenge businesses lacking tool expertise. Key advantages of hiring consultants include:
Solutions
Contacts
(11) 5198-7201
(11) 98609-9250
(11) 98644-3365
info@whiteweb-it.com
Business Hours
2ª a 6ª – 9h às 18h
Address
Av. Ordem e Progresso, 157
Conj. 901
Barra Funda – São Paulo – SP
CEP:01141-030
© 2021 WhiteWeb · Intelligent Processes
30.243.420/0001-60
Powered By Miranttus